Map Your Miami
Role: Data Visualization and Interaction Designer
Timeline: 4 Months
Client: University of Miami Capstone
INTRODUCTION
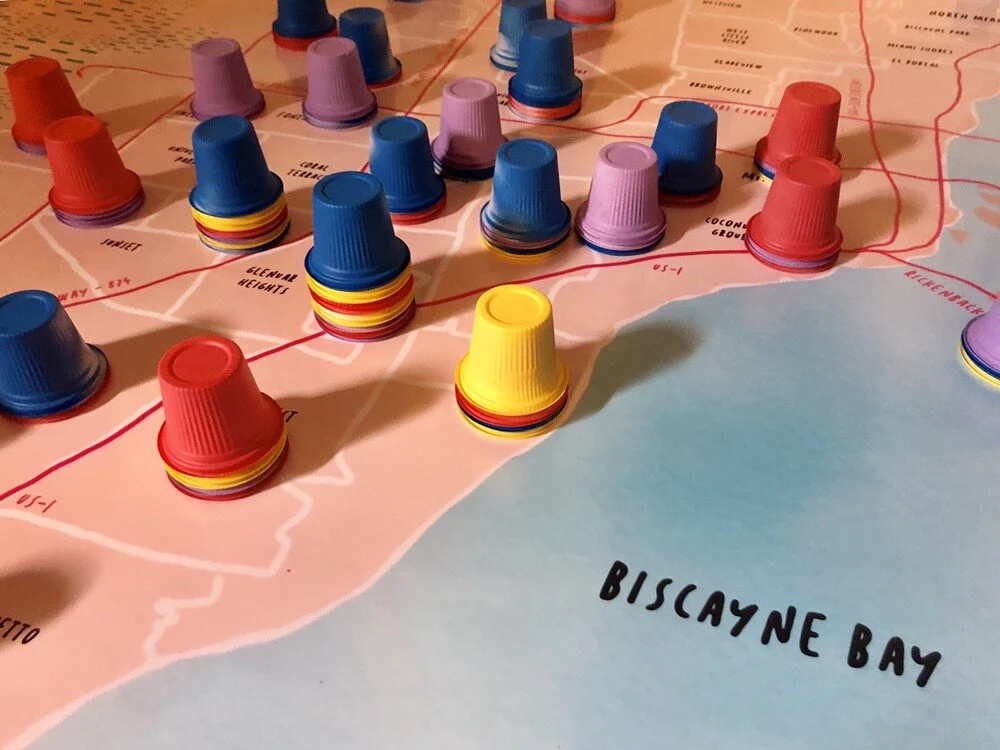
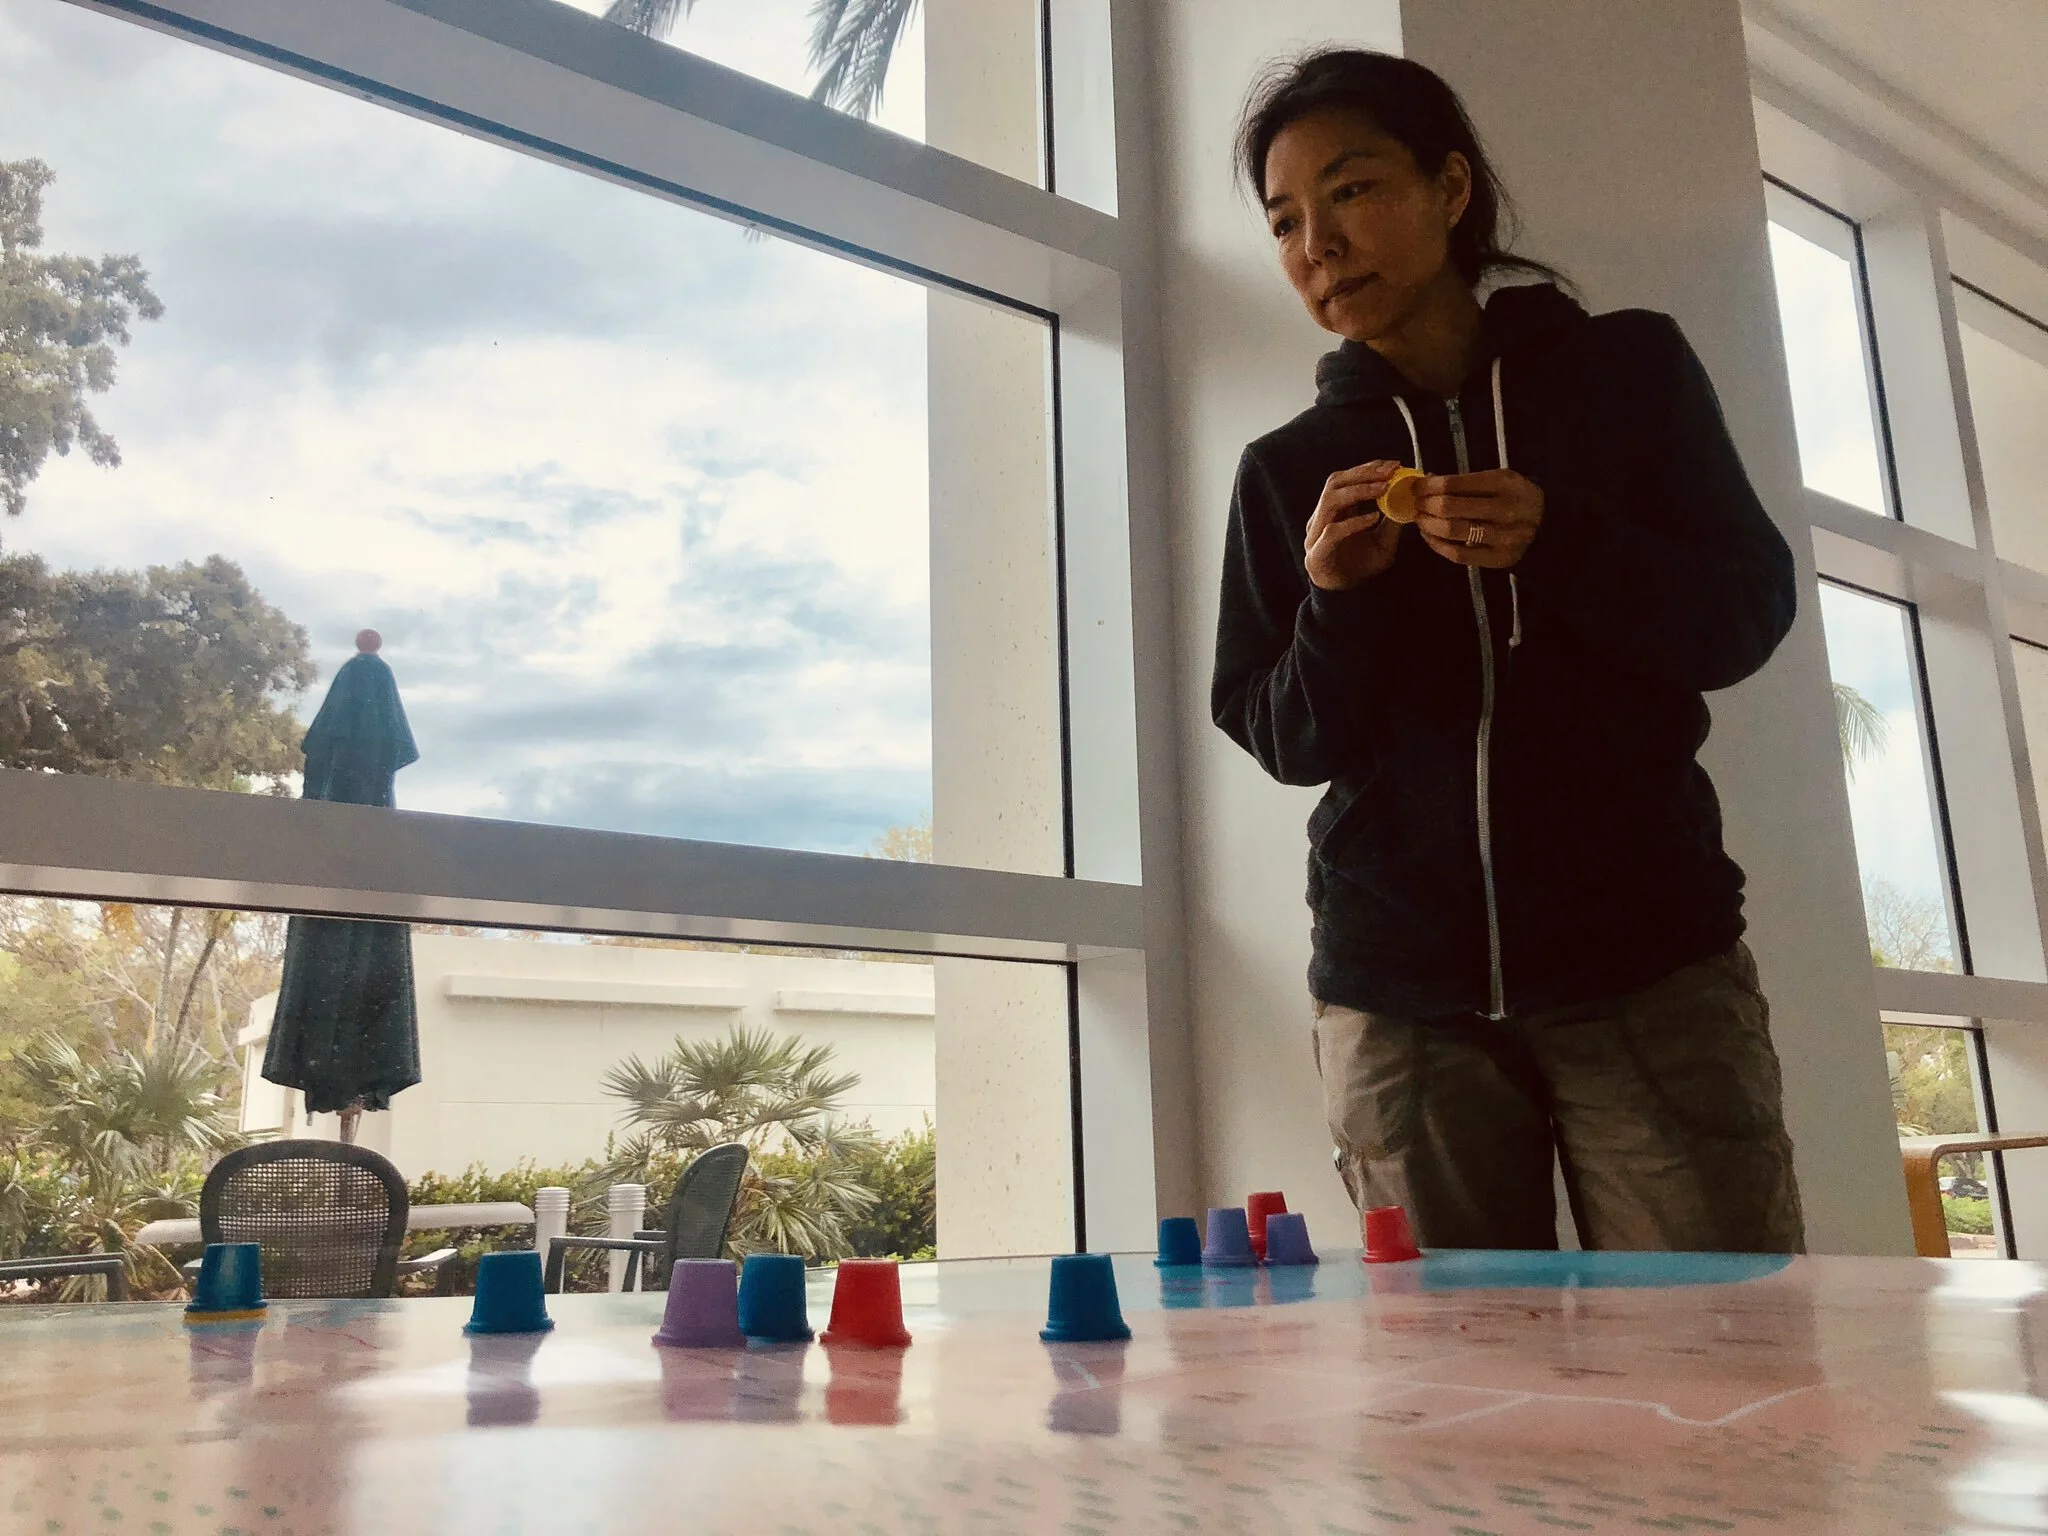
Map Your Miami is a participatory map that drives residents to have a conversation about the city they live in.As a cultural nod to Miami, the map features color-coded Cafecito cups that correspond to four categories: live, work, eat, and favorites. Participants use the cups to map their Miami! The project aims to activate the space in a way that residents and visitors alike can interact with the city and contribute their own narratives on the map.
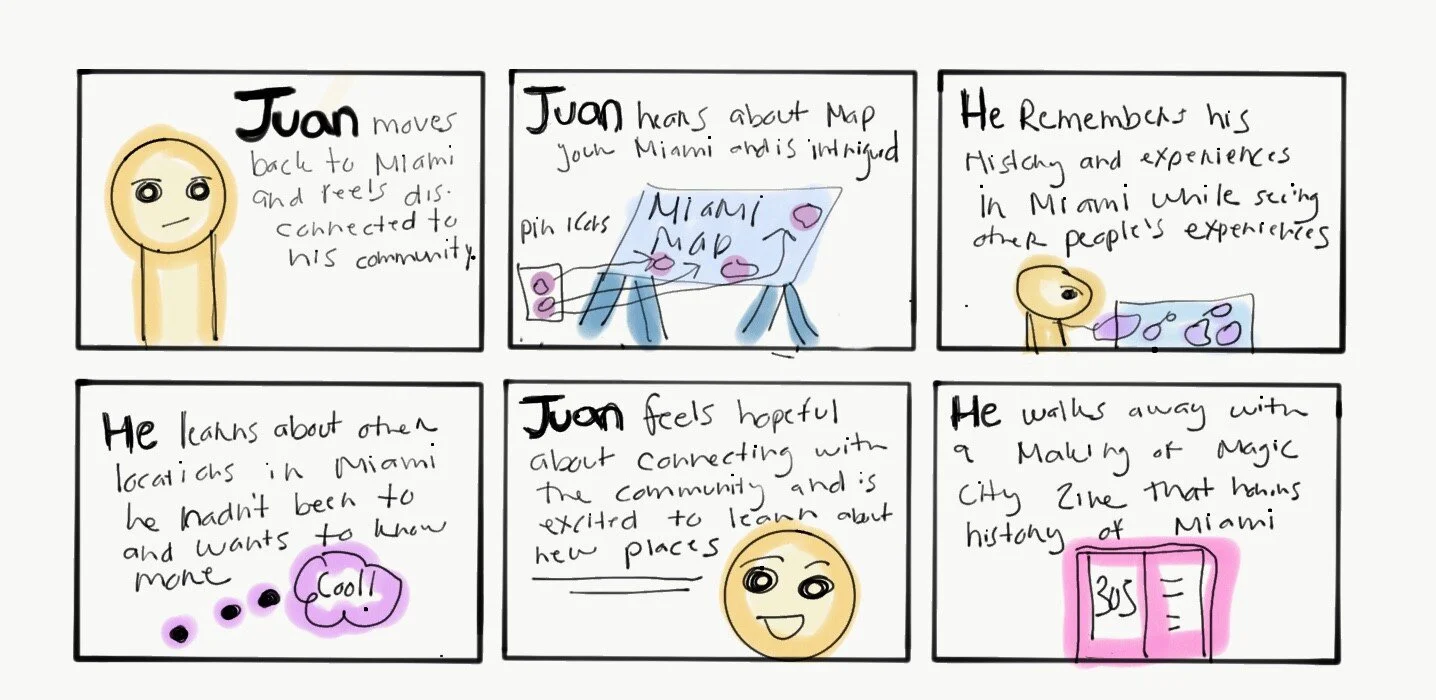
STORYBOARD
Juan’s a Miami native moving back to the his hometown after time away. He feels disconnected with a city he’s from, how can mapping help him reconnect with his home?
MAPPING INTERACTIONS

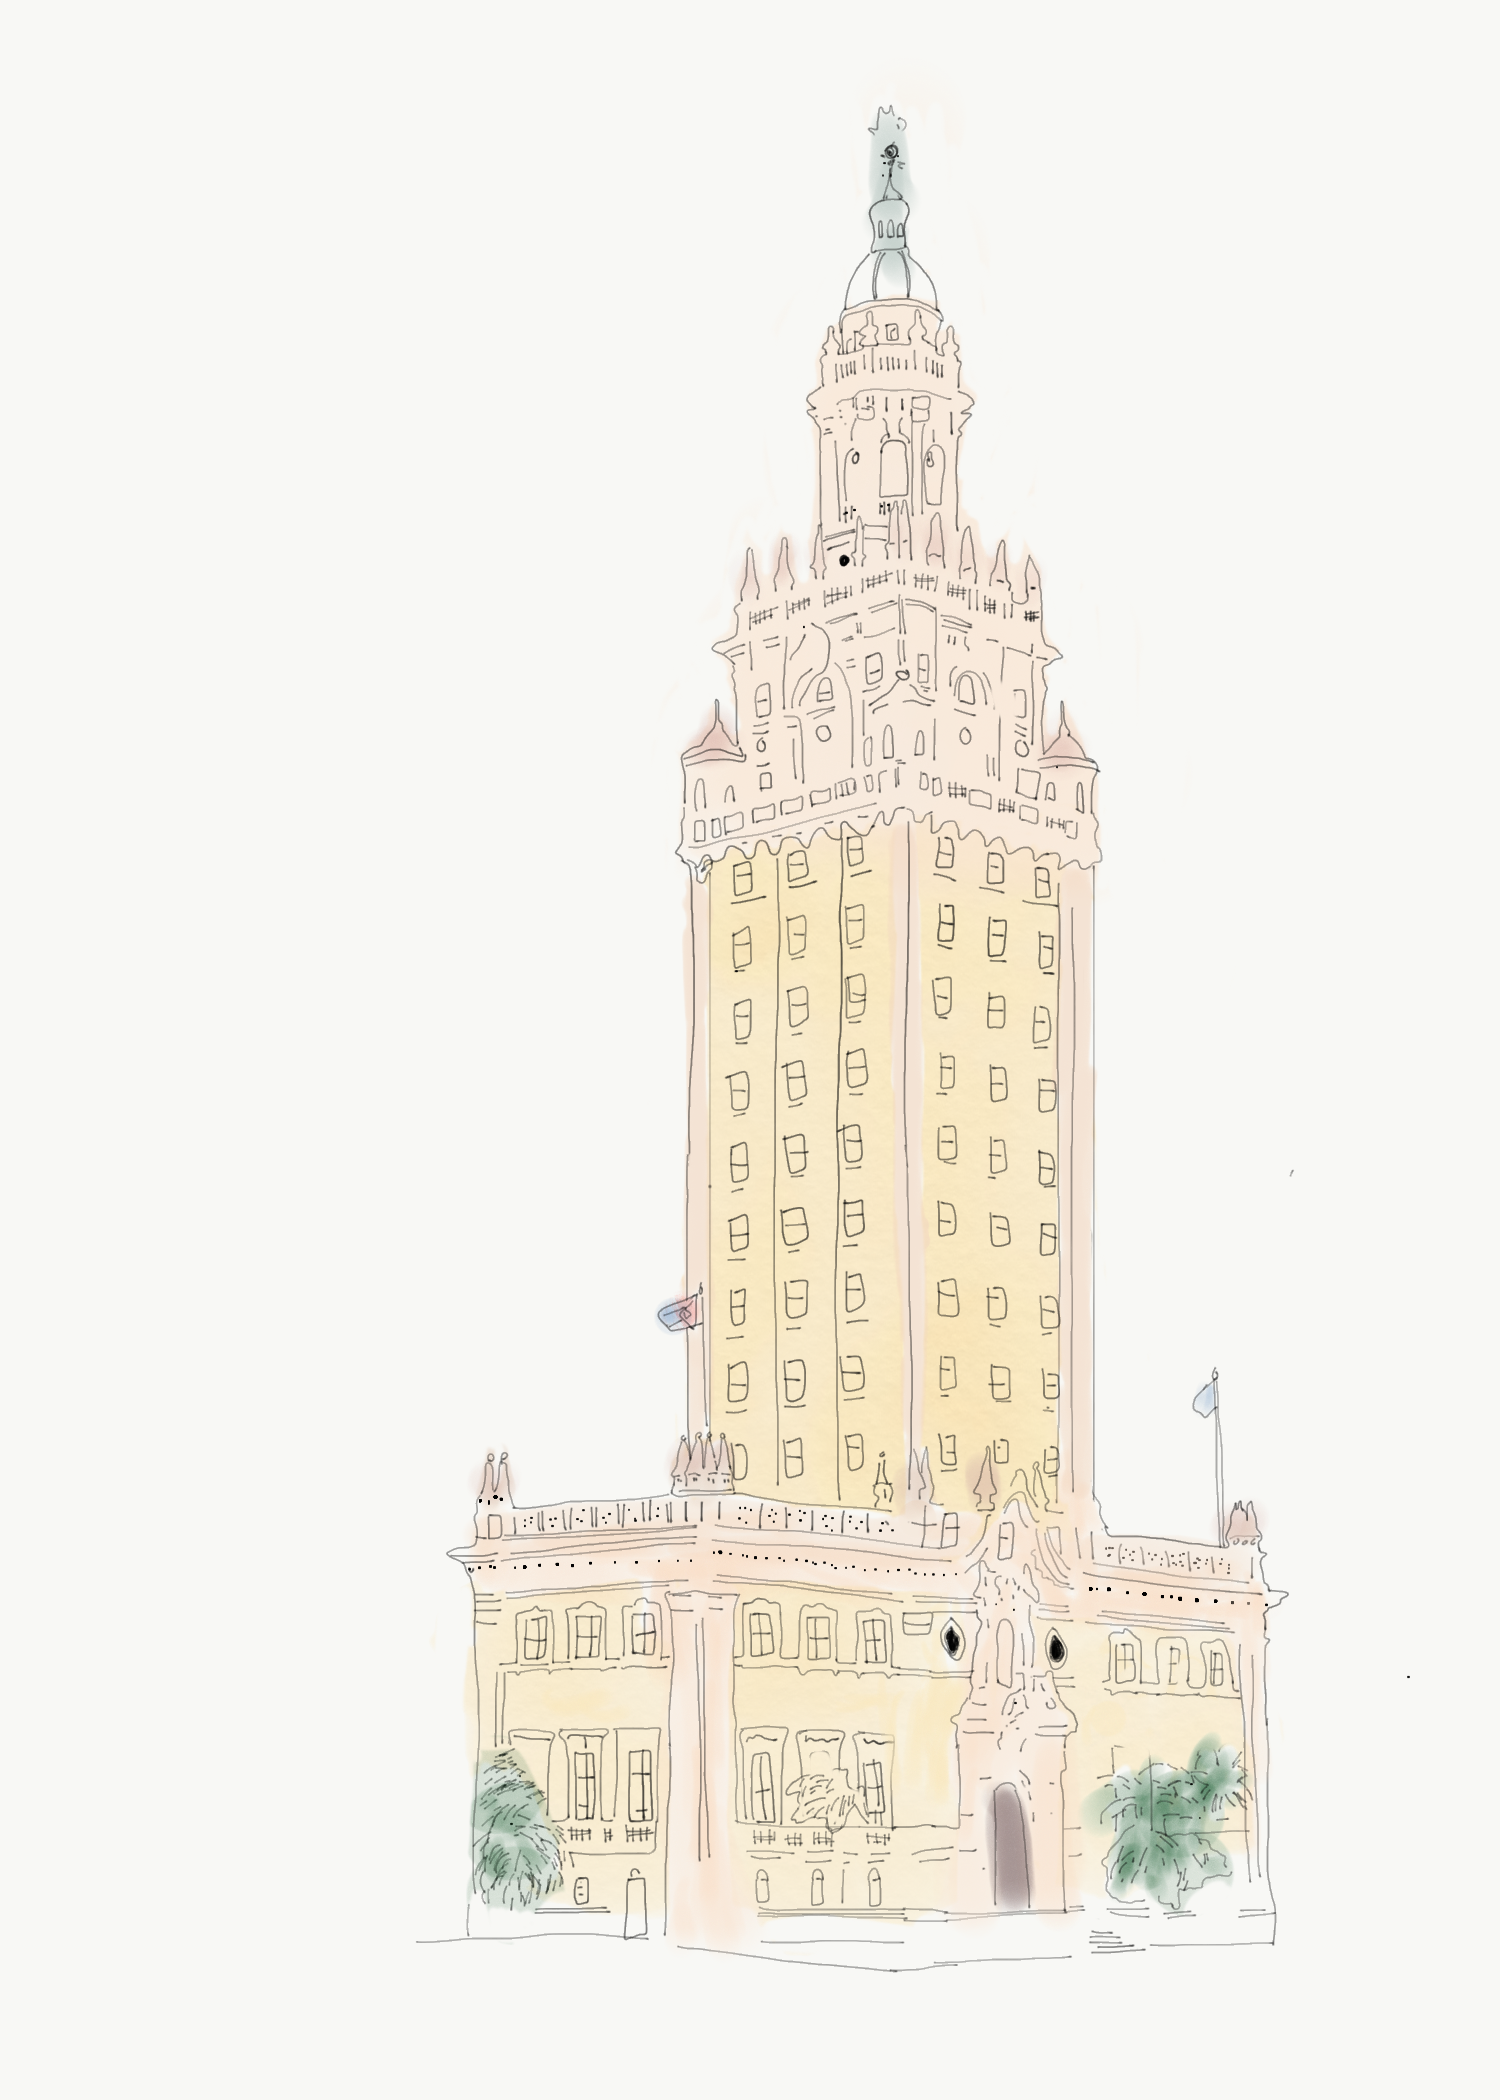
As a Miami resident who has spent a great amount of time away from the city, I am often met with an inaccurate perception of my hometown. Miami is seen either as a vacation city, a party town, or an inaccurate combination of both. Rarely, the perceptions are matched with the rich multicultural history proven to be influential to this day. As my capstone project, I wanted to create a visual history of Miami that will include how architecture, demographics, cultural institutions, and local legends have shaped the current landscape of the city.
MAP MARKERS


MAPPING TRIALS

USER FEEDBACK
In my exploratory sketches, I liked the idea of a collage of illustrations that would showcase a representation of Miami’s history. I considered including previews of content based on the timeline structure so the user clicks an icon, they would see a pop-up window with a description, enabling them to visit the more in-depth page.
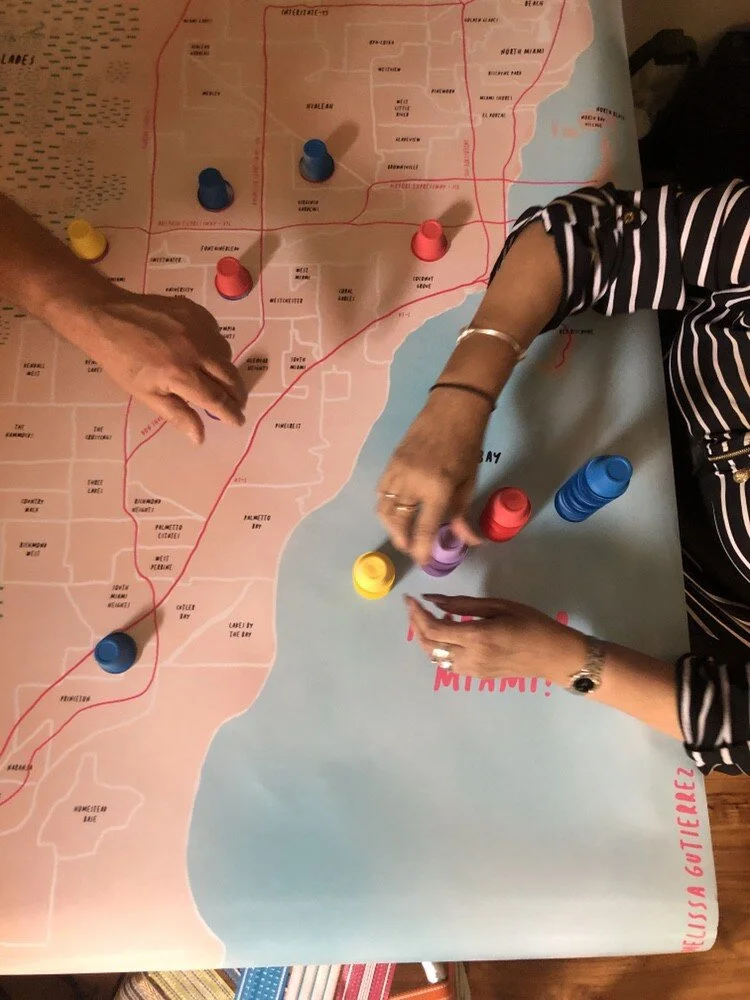
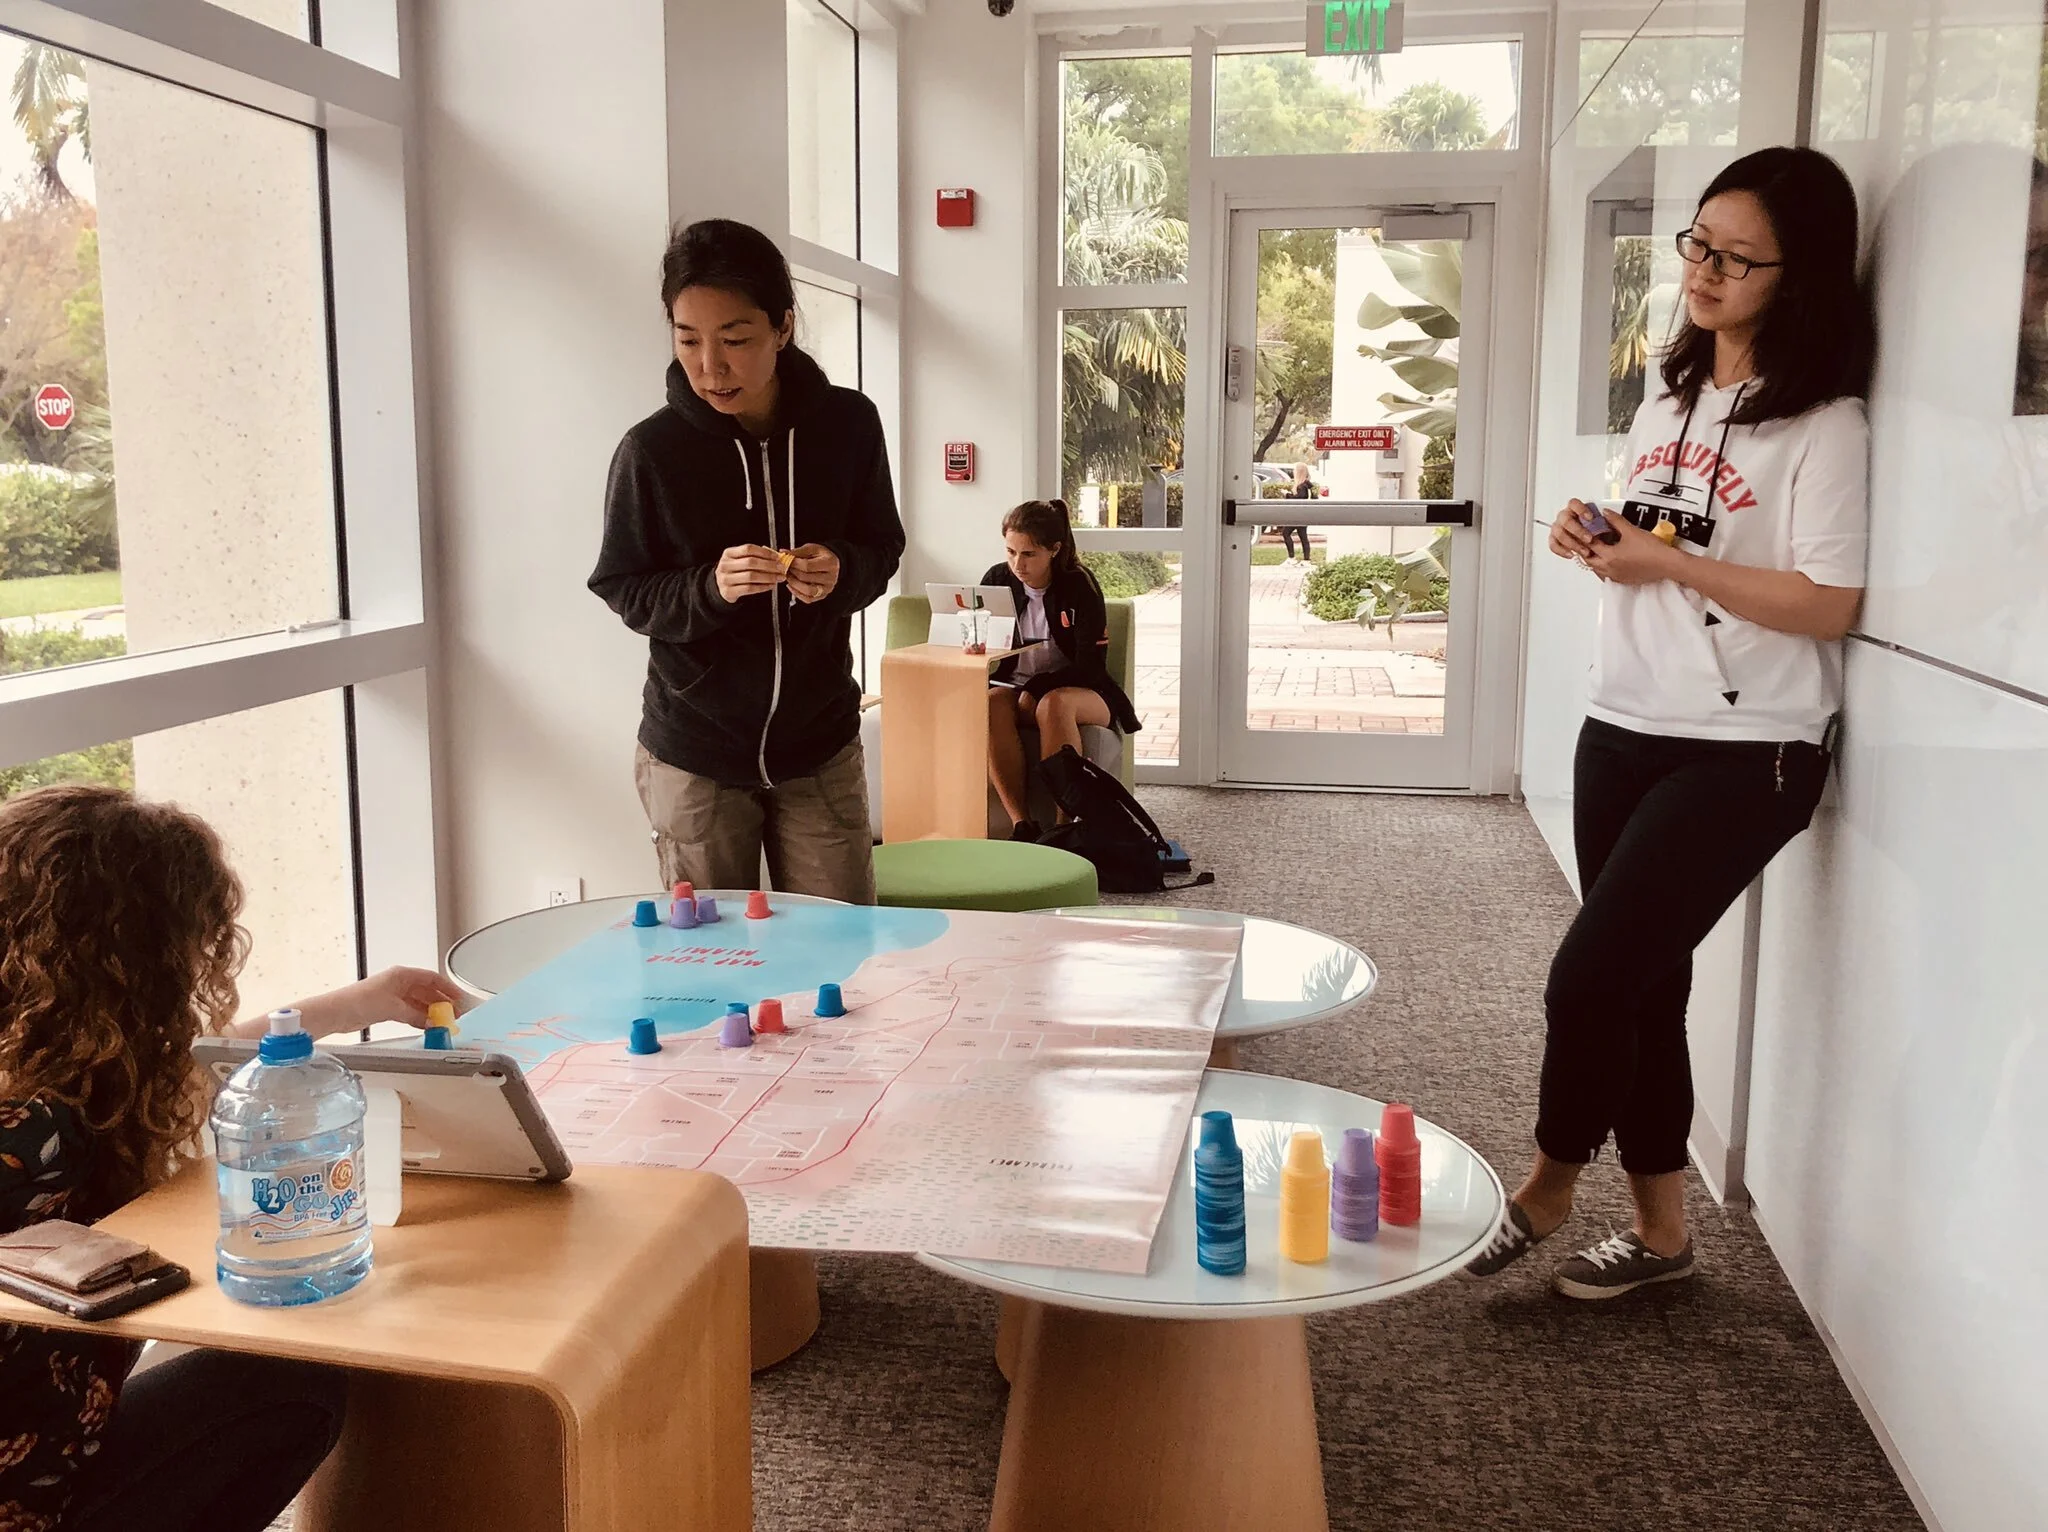
Mapping Workshop
The next steps of this project is to keep building on community participation and gather feedback based on new content and categories Miami residents suggest as integral parts of their city.