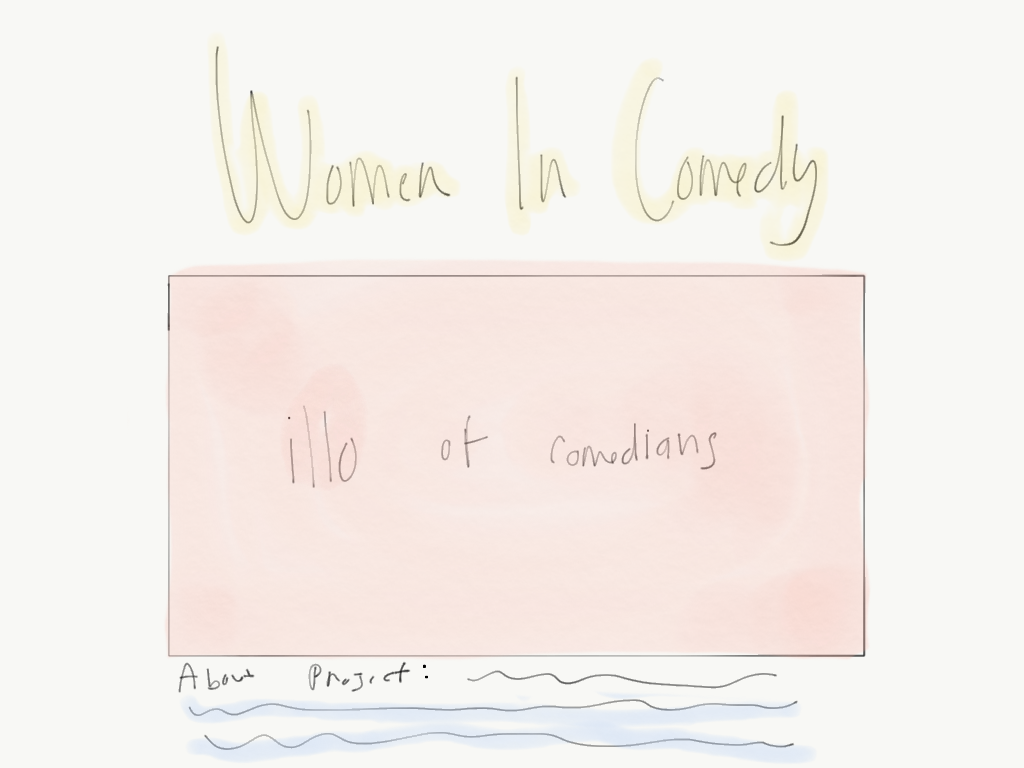
THE EVOLUTION OF WOMEN IN COMEDY
In tumultuous times, we turn to laughter as a coping mechanism. This data visualization project explores how the landscape of comedy has evolved throughout the years. By looking at some of the most influential comedians, we are able to see how culture and popularity change over time. Utilizing Google Trends data, we see a major shift in representation of women comedians from the 1930’s to present day.
Live project available here: The Evolution of Women in Comedy

research
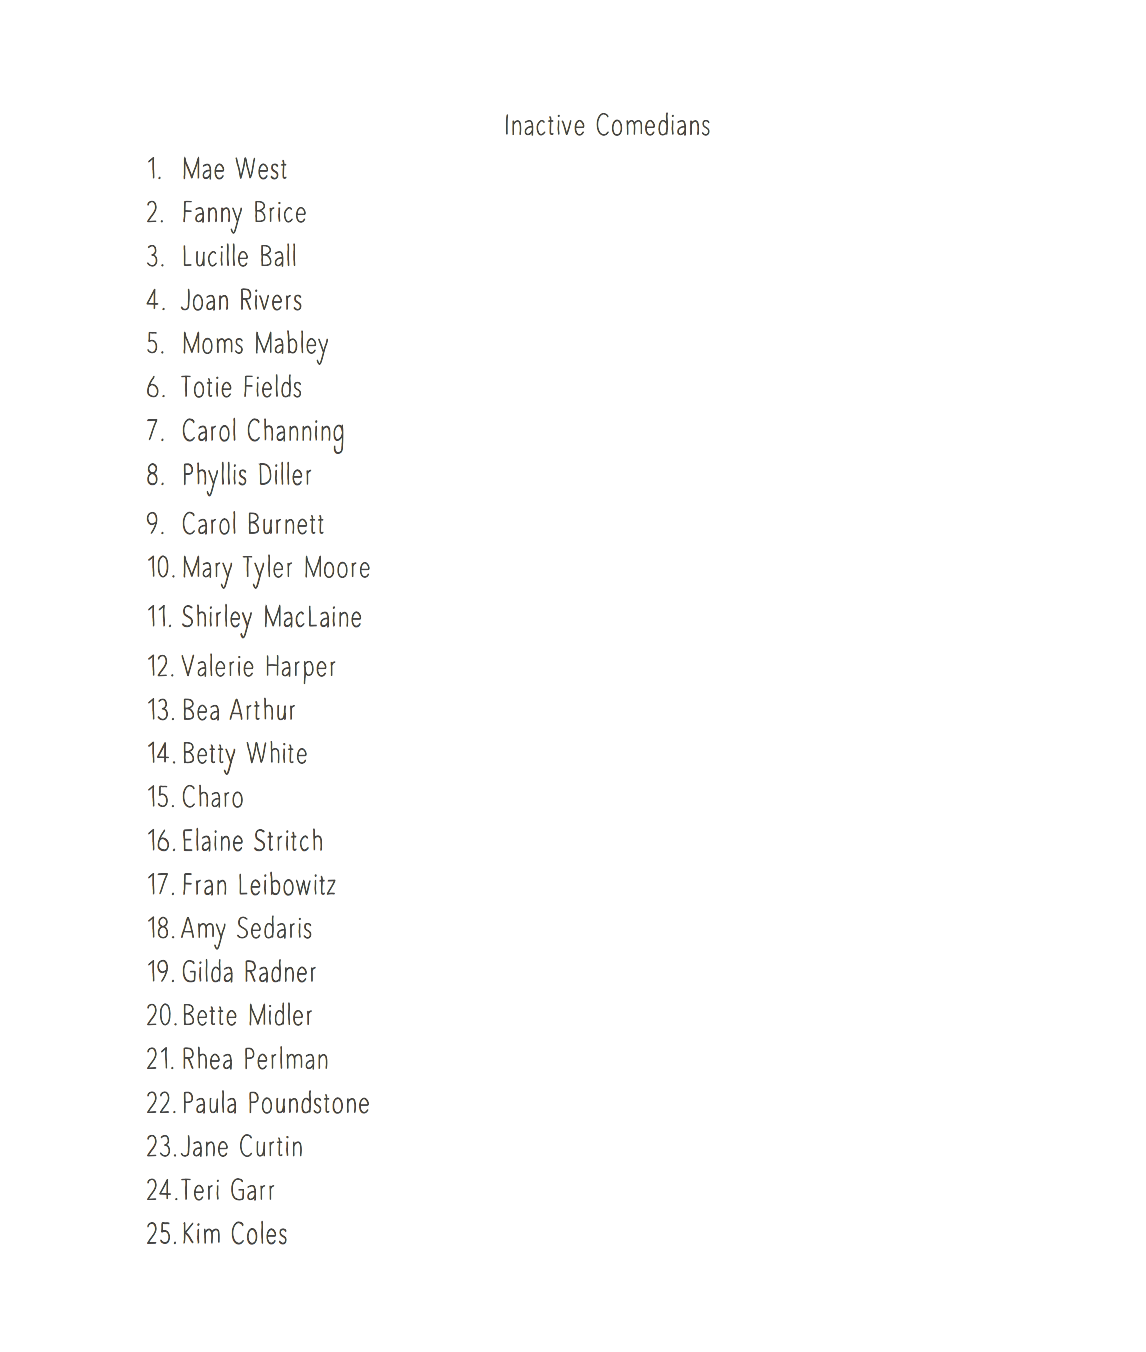
In the early stages of my project, I needed to narrow down my search in order to get specific data from Google. I knew the focus of project wanted to showcase the history of women comedians while also highlighting a diverse set of trailblazers in the industry. I compiled a list of 50 comedians, grouped into two categories of inactive and active comedians. Once the list was complete, I submitted the request to Google and received data from 2004 to current day displaying the Google search data of each of these comedians.


Categorization
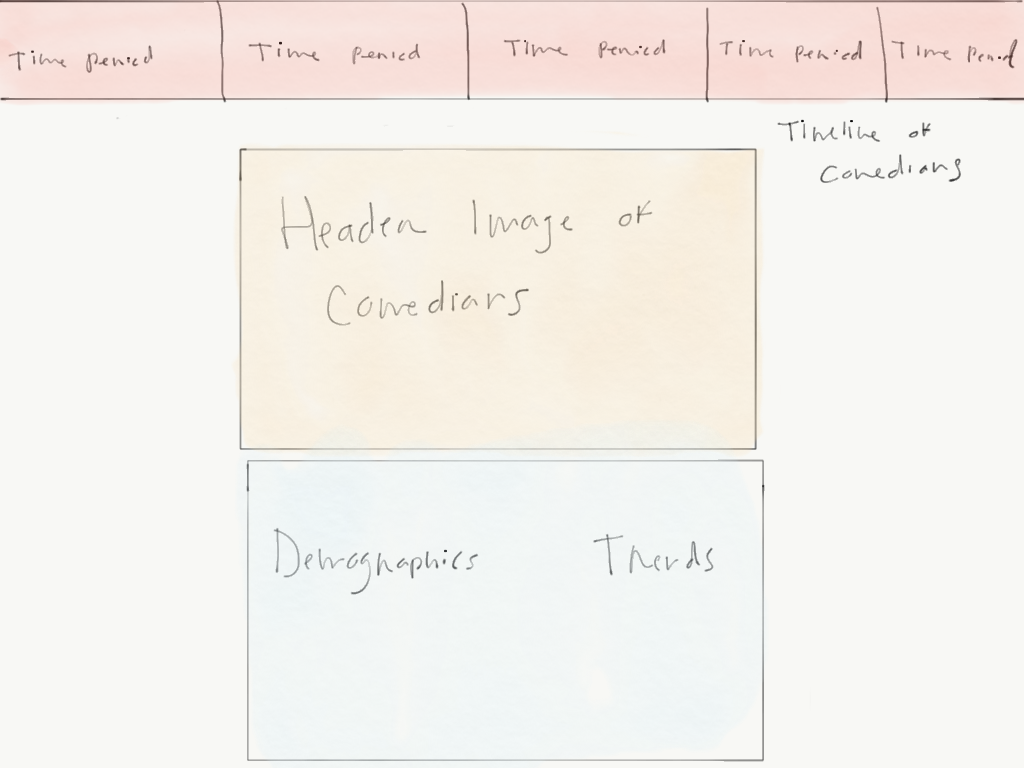
In early considerations of the information architecture of the website, the concept of a timeline felt like the best way to display the data in a chronological order. Comedy often reflects cultural shifts and the comedic style prevalent in popular culture can be indicative of a specific time period.
sketches
When thinking about the timeline feature of the site, my main goal was to highlight these influential comedians and describe the moment of history they were a part of while showcasing how the demographics and search data changed over time.
Illustration
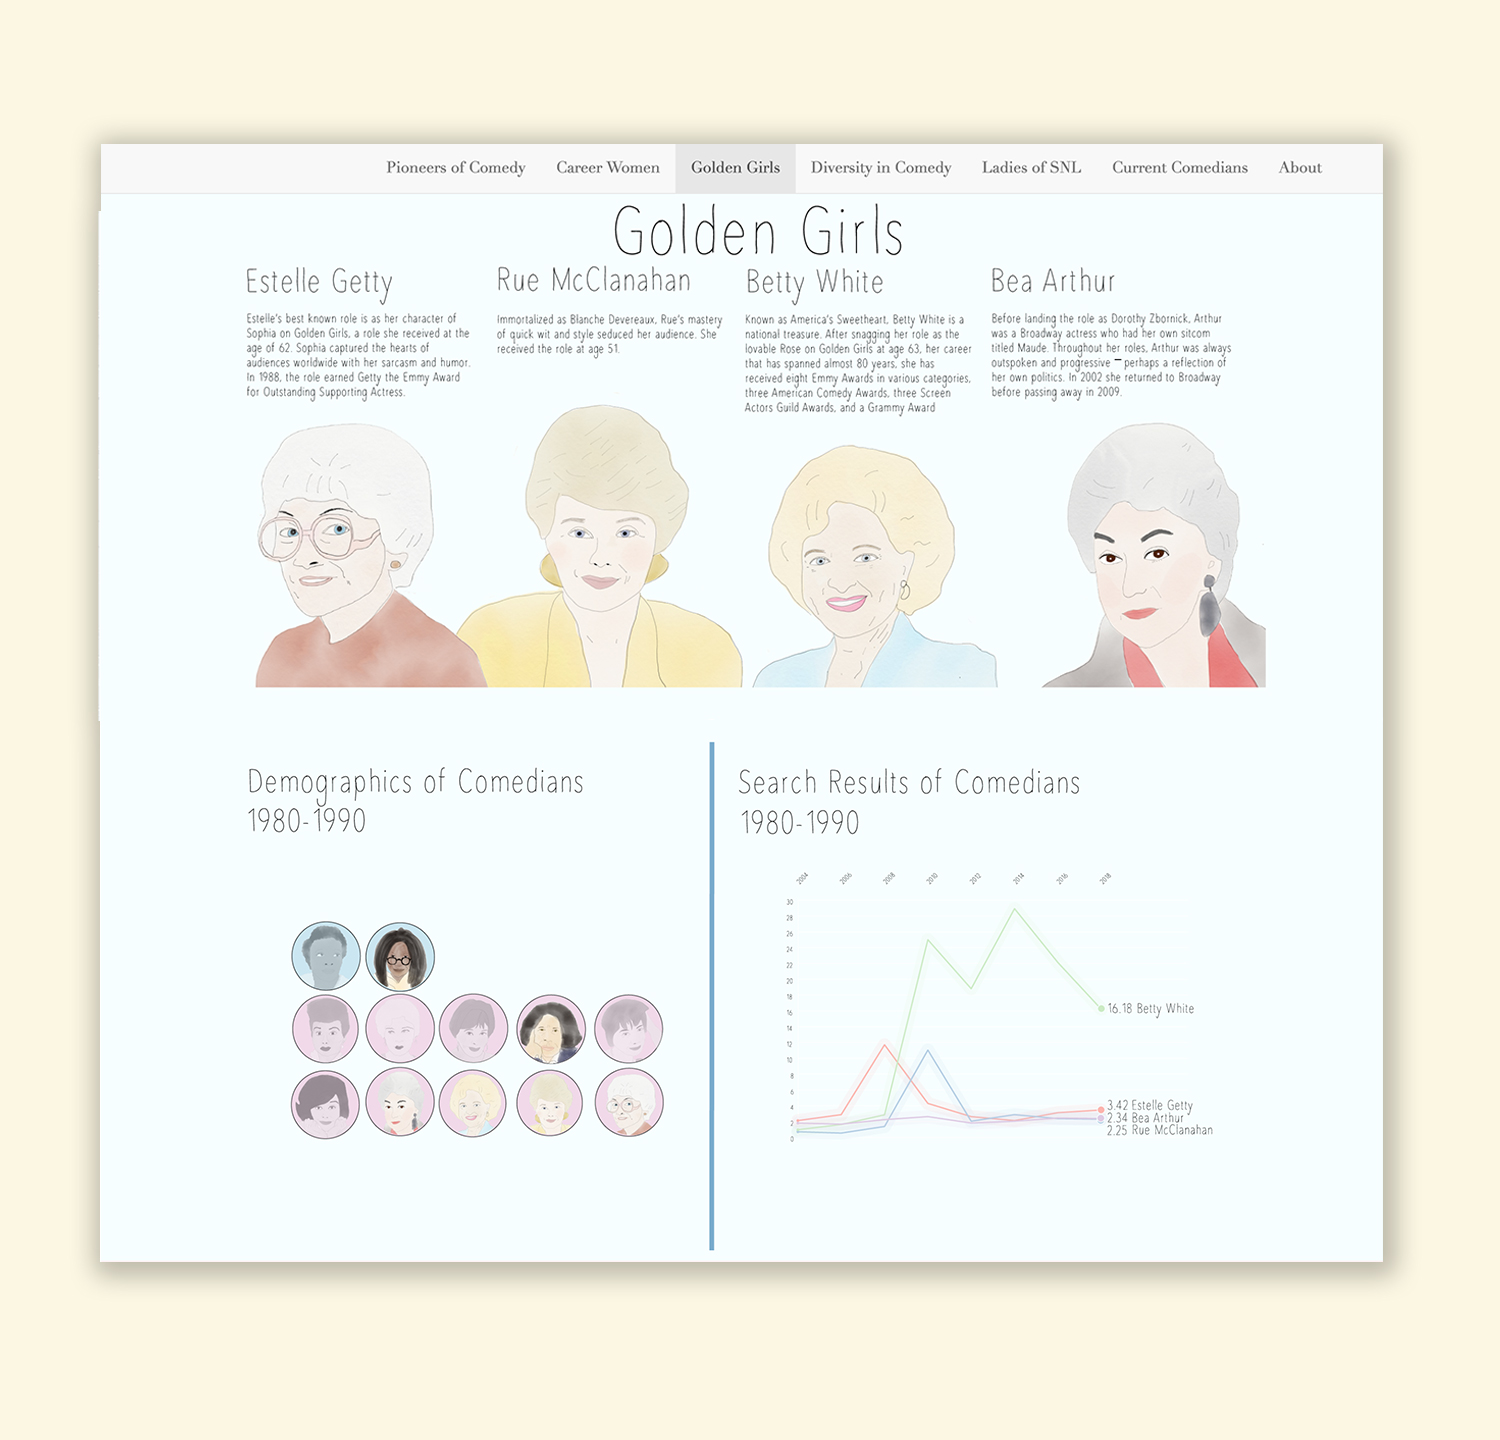
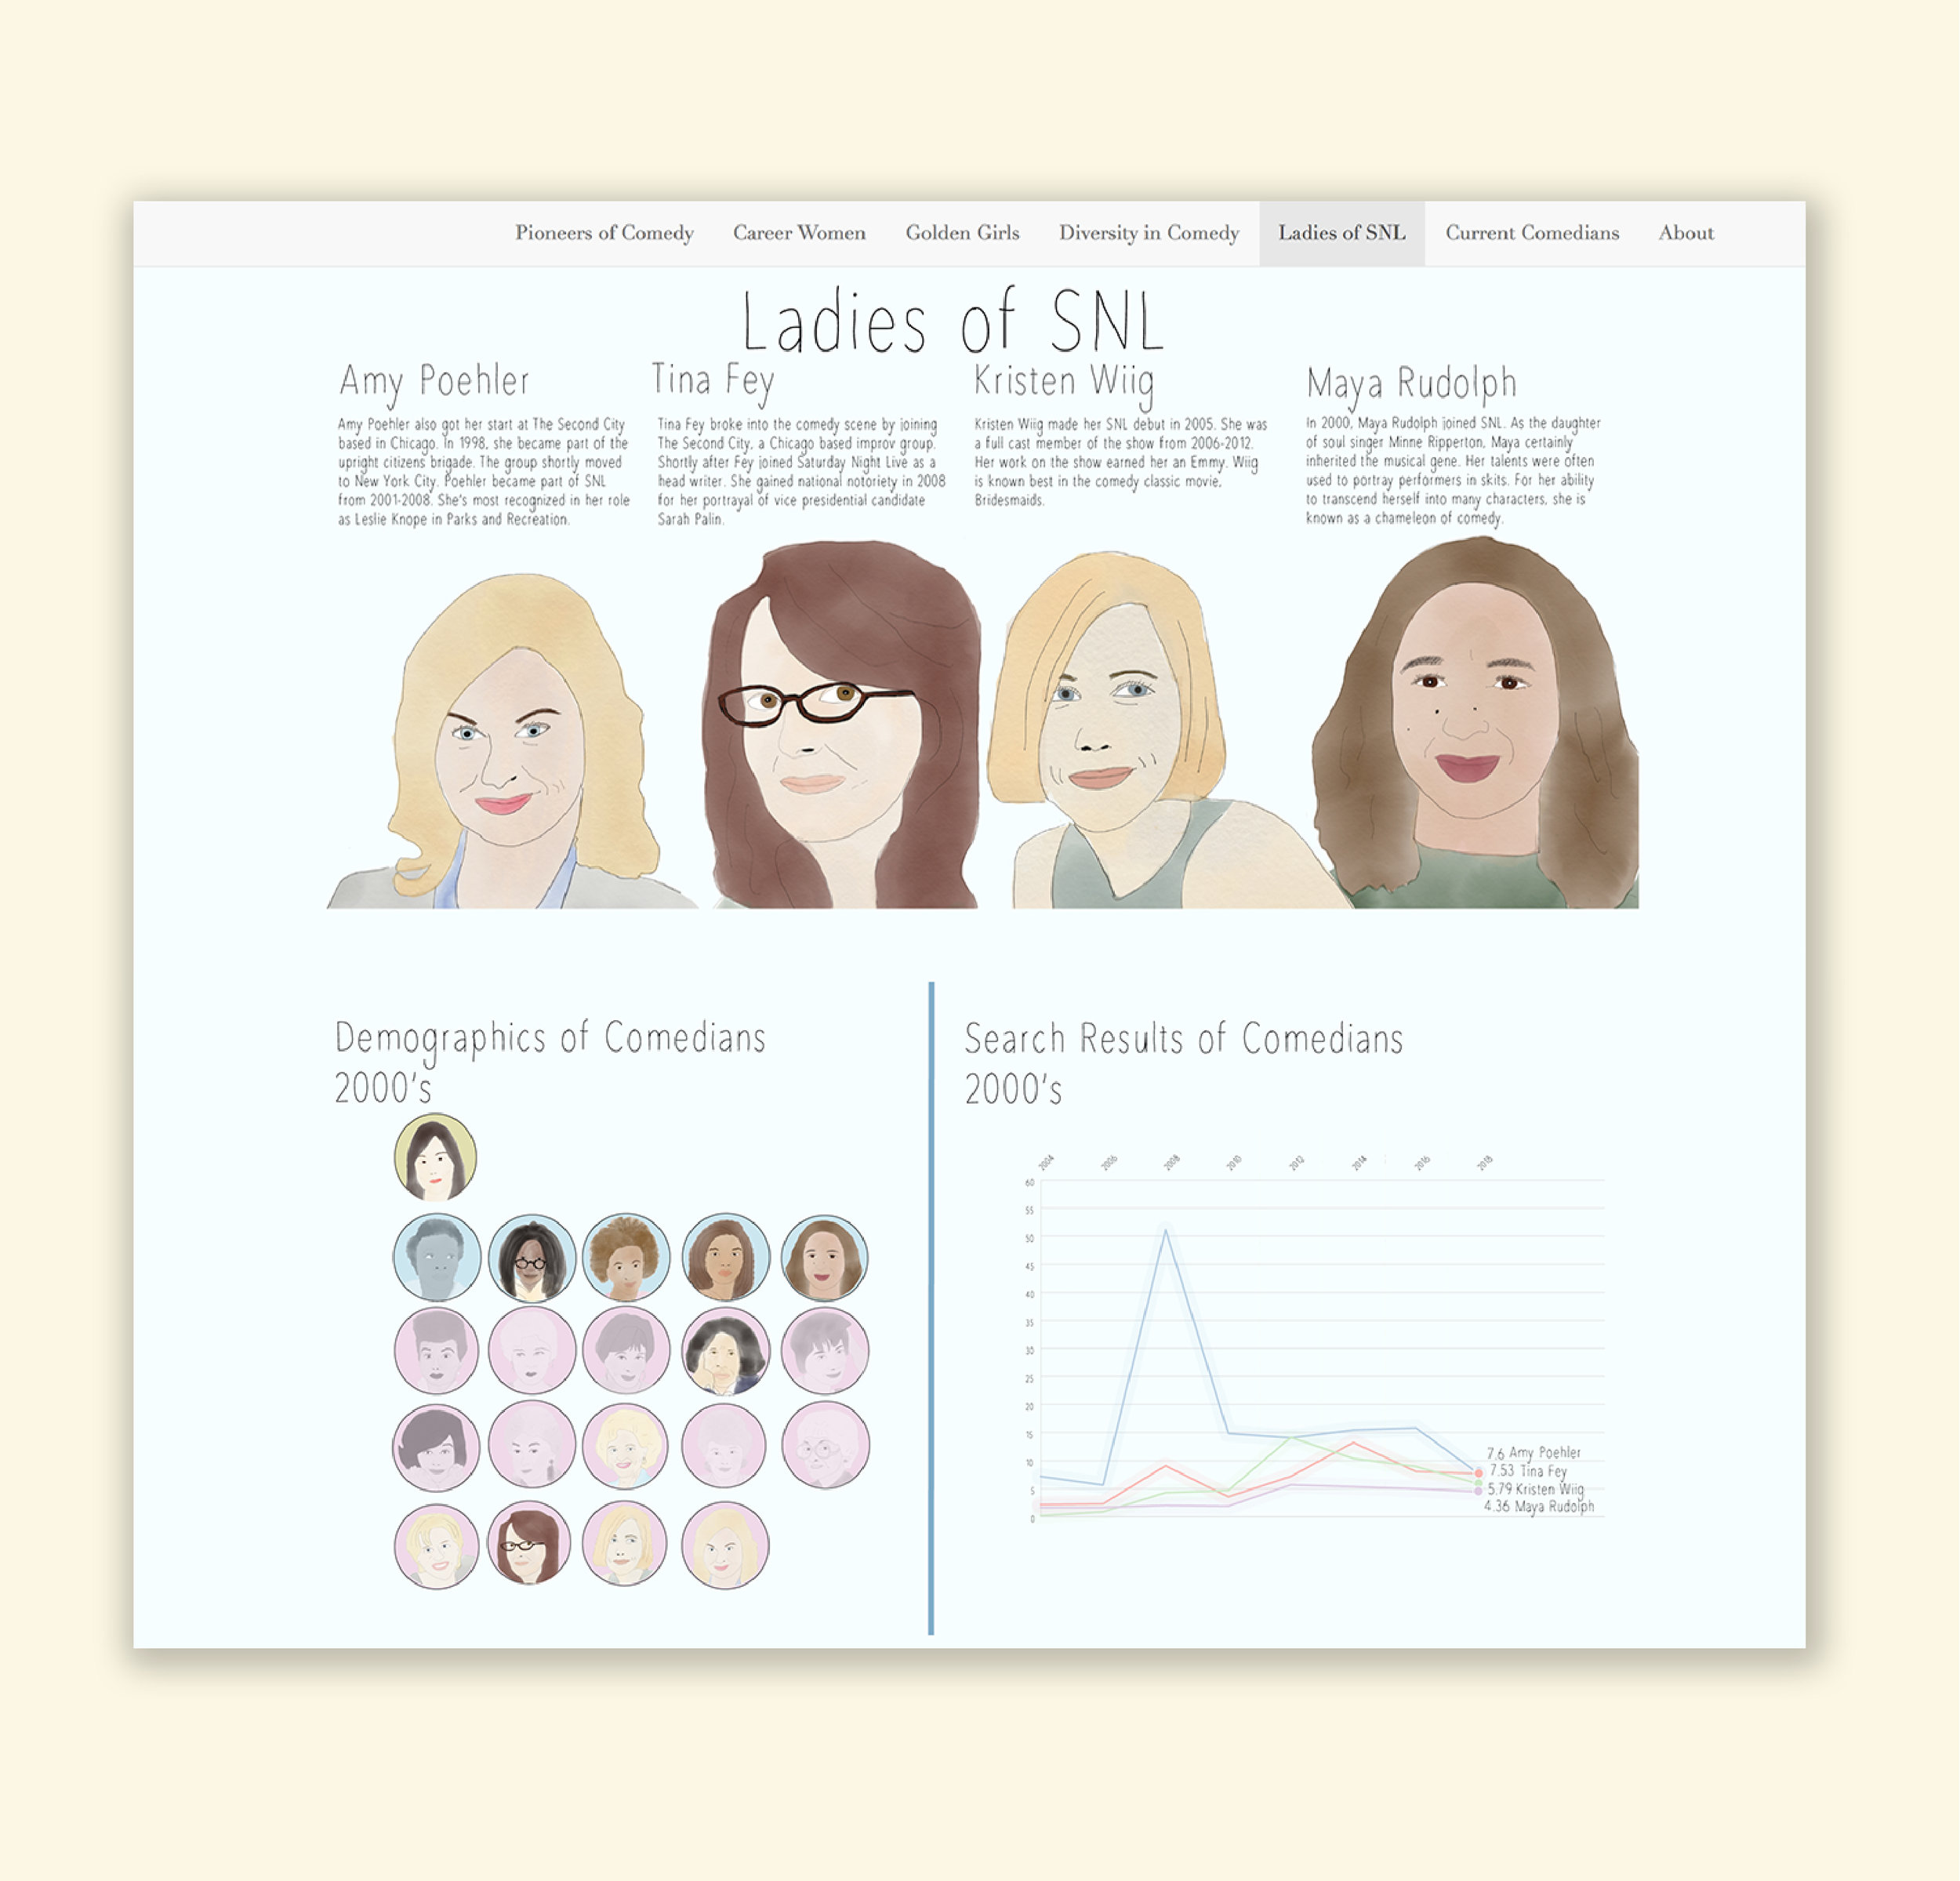
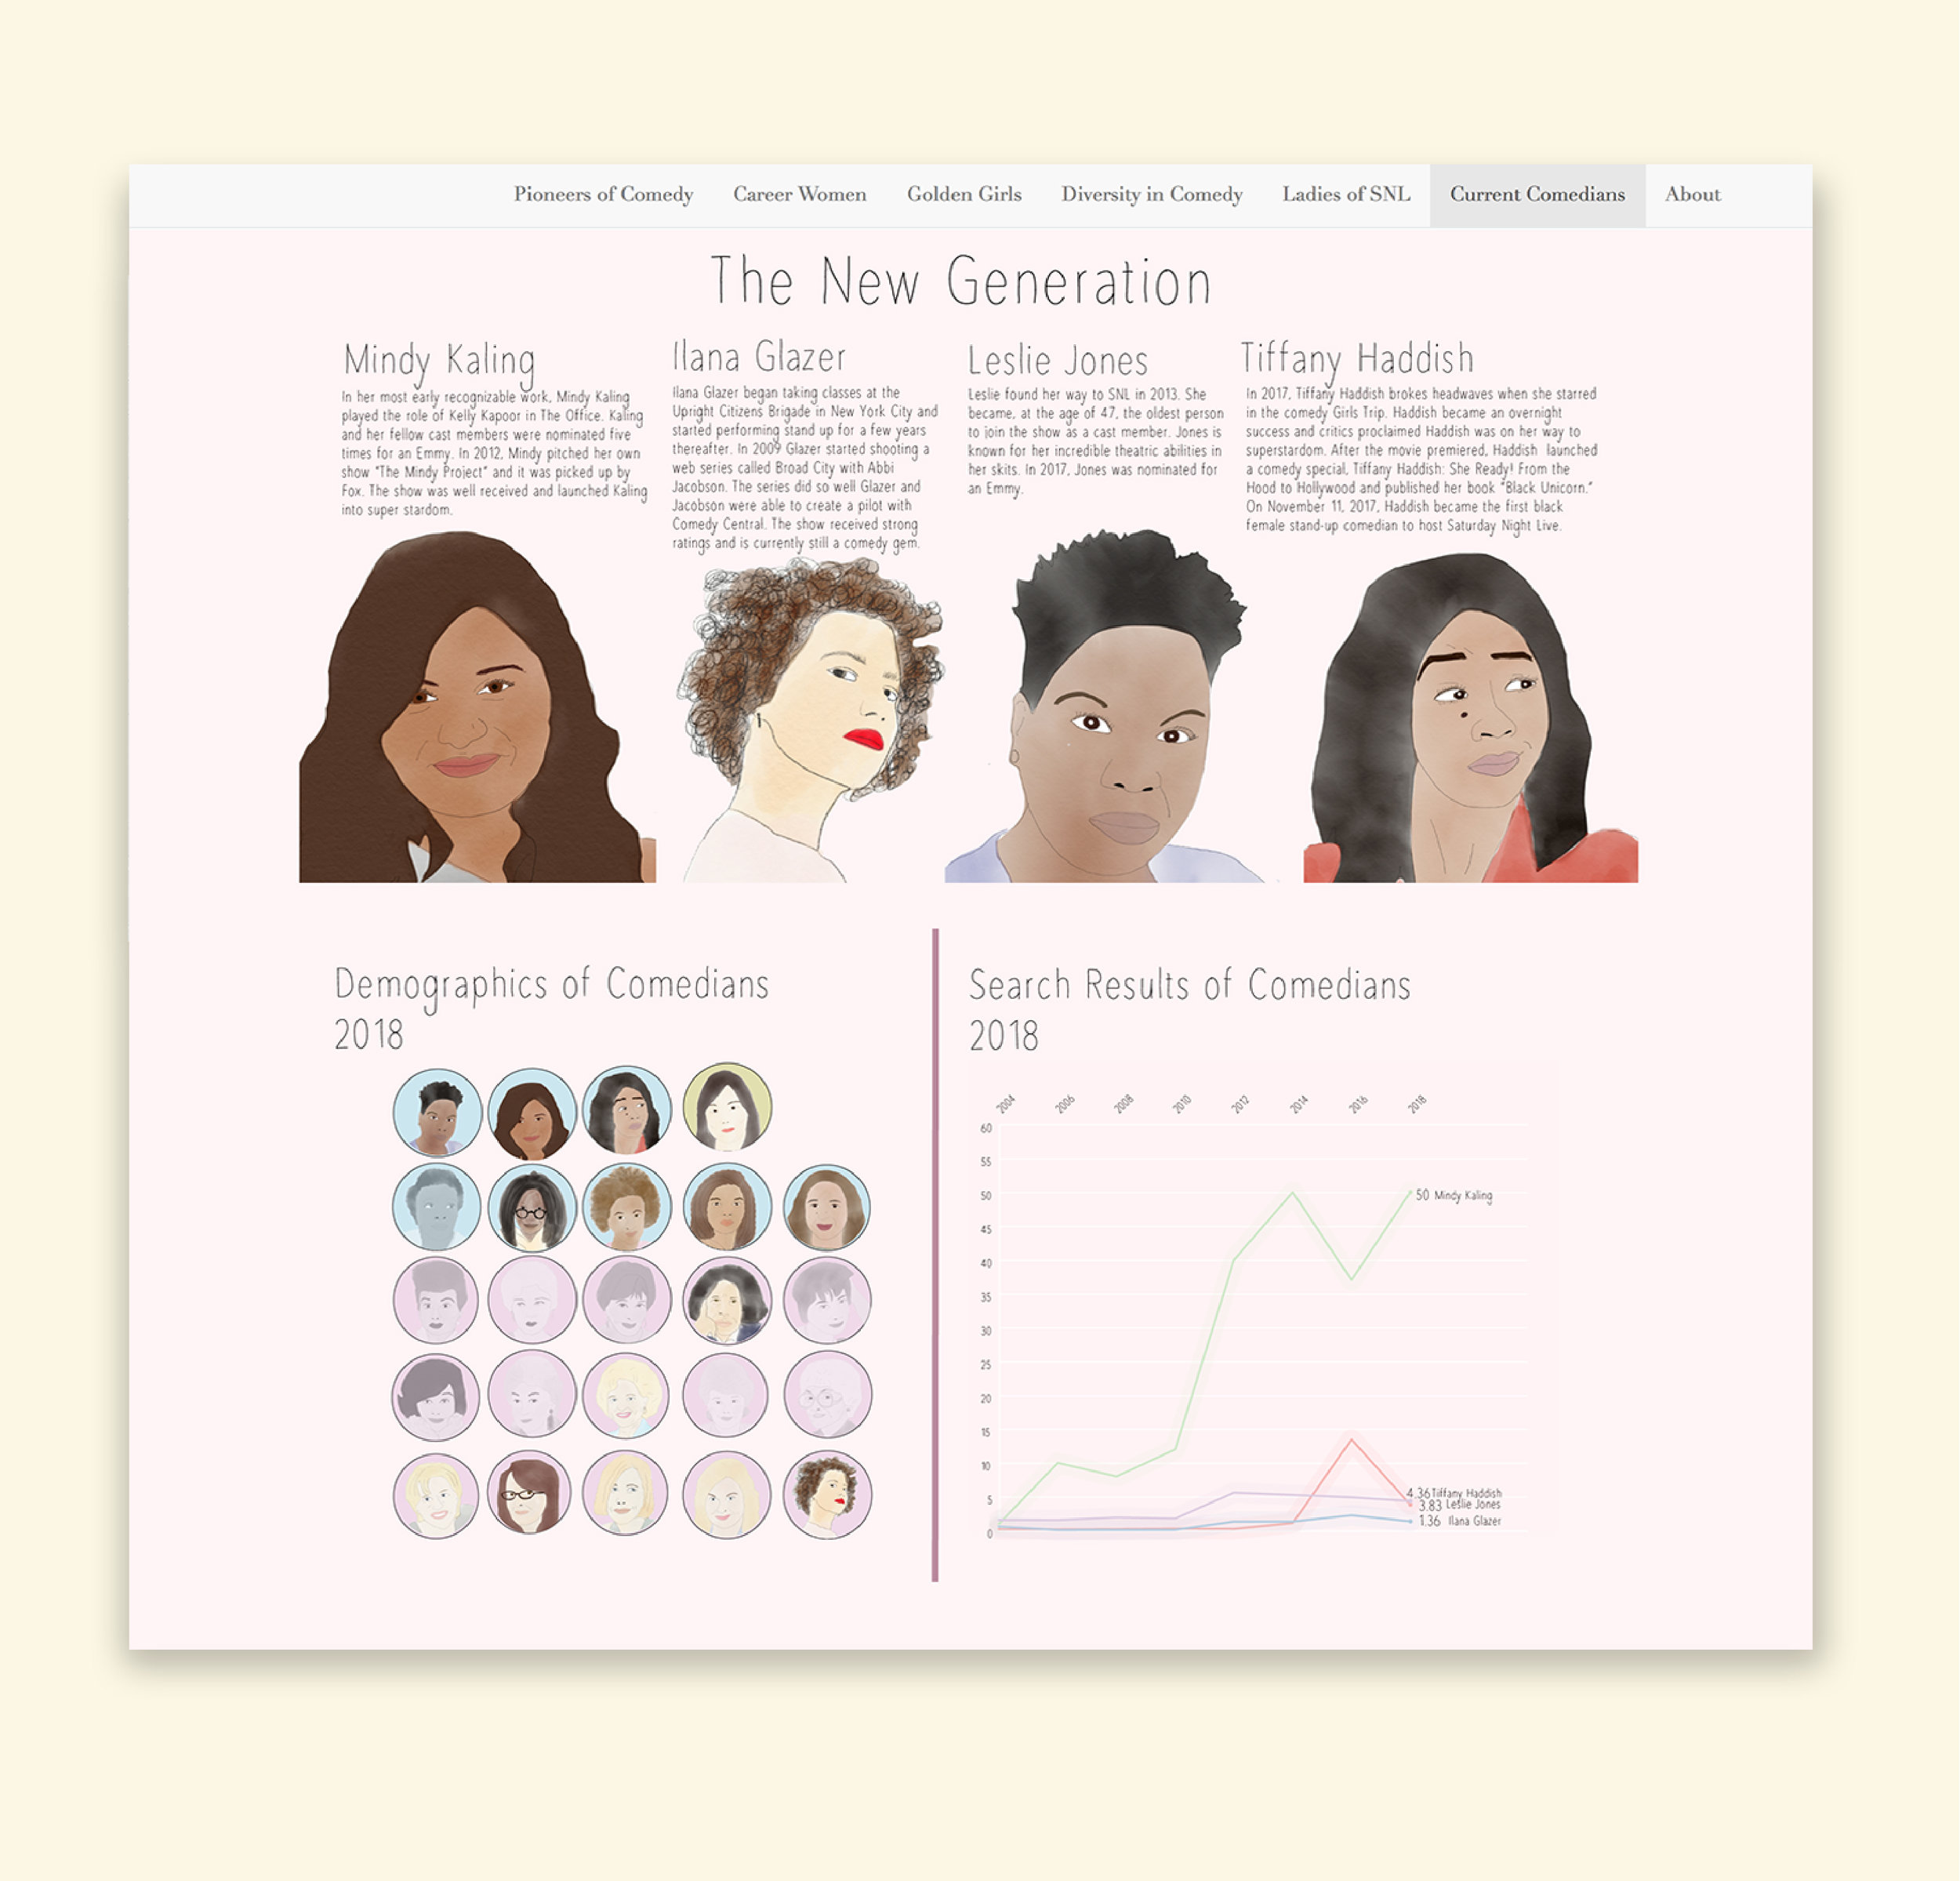
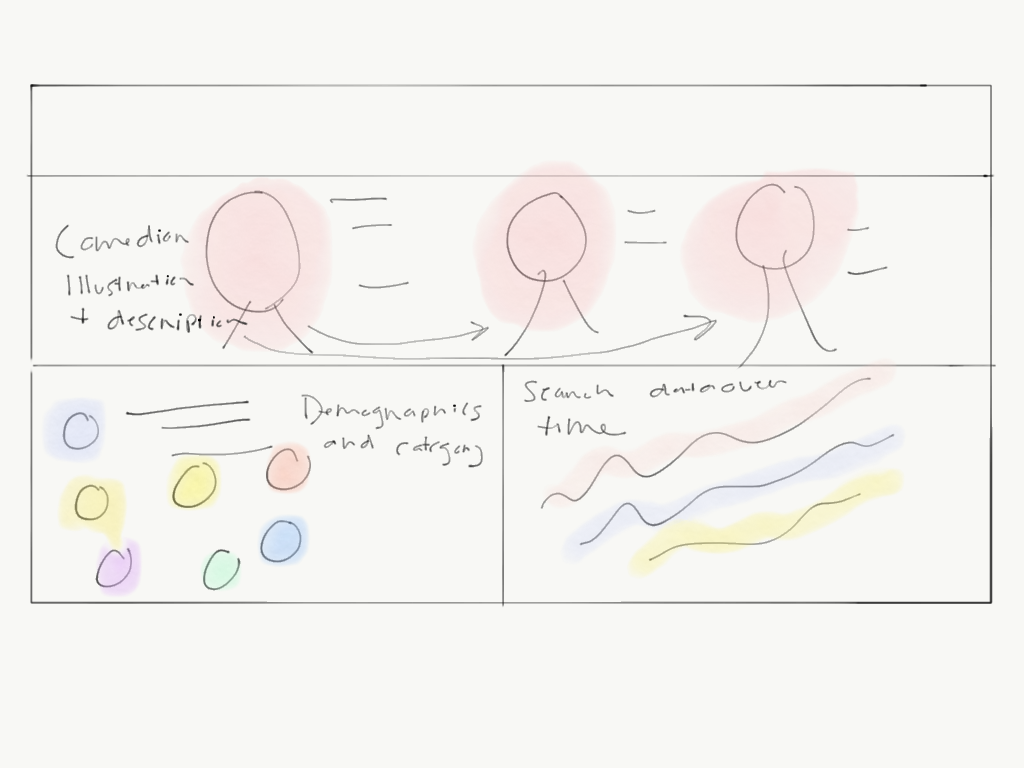
I wanted to include a hand drawn style when displaying the groups of comedians over time. Alongside this style, I wanted the drawings to have a pastel color palette, as well as the data visualization accompanying them.

final site

The final site included the pastel color palette as well as the combined illustrations of the women comedians over time. Below the group illustration, there is a demographic section showing how representation of comedians shift over time and how popular these comedians are throughout the years.